9 results
1st grade statistics projects
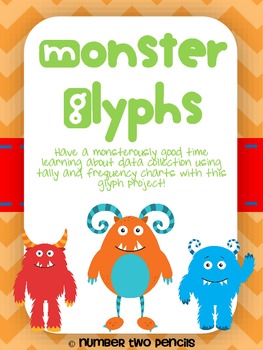
Monster Glyph and Graph
In this monster glyph activity students create a unique glyph while teaching classmates about themselves. Students then use the class glyph to collect and analyze data, creating their own graphs as displays. This project is especially great because its complexity can be easily differentiated across grades and customized for the individual needs of your students.
This work is licensed under a Creative Commons Attribution-NonCommercial-NoDerivs 3.0 Unported License.
Subjects:
Grades:
1st - 4th
Types:
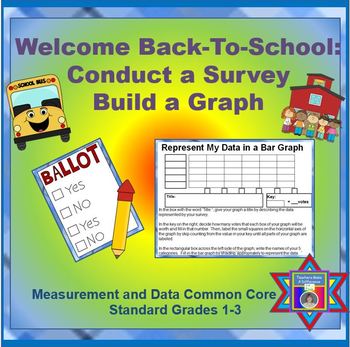
Graphs FREEBIE Back-To-School: Conduct a Survey & Build a Graph (CCSS Aligned)
FREE!!! FREE!!! FREE!!! FREE!!! FREE!!! FREE!!! FREE!!!
PLEASE take time to provide feedback in exchange for the download! I appreciate your time!
I created what I hope to be a fun but helpful resource for your students in Grades 1-3. In return, I ask that you please take time to rate and leave feedback to let others know how the activity worked for you and your students. I appreciate your time and effort!
In Grades 1-3, students are expected to be able to build their own bar
Grades:
1st - 3rd
Types:
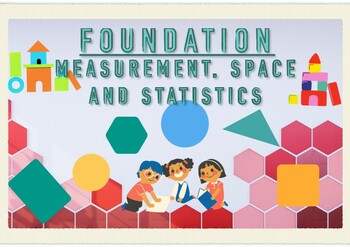
Foundation Maths MSS Play Activities, Australian Curriculum 9.0
PLAY, EXPLORE, APPLY. This Maths Measurement, Space and Statistics bundle based on the Australian Curriculum version 9.0 allows you to have hands on play activities to use as small group rotations or to engage with concepts through play. This is designed to work alongside your Maths units and be flexible with no fuss activities to engage your students. In this bundle you will have a set of activities to play with, a set of questions to explore for each activity and a page for tracking how studen
Subjects:
Grades:
PreK - 1st
Types:
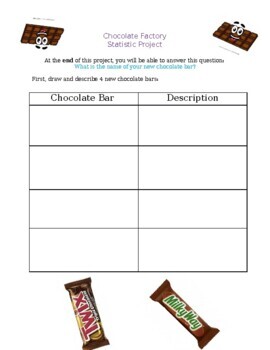
Chocolate Factory Statistics Project with Rubric
Chocolate Factory Statistics and Probability ProjectStudents are to come up with different chocolate bar designs and collect data on which is the most popular.At the end of the project, students can have a go at creating their chocolate bar packaging! Please see the store to see an additional, more comprehensive rubric.
Subjects:
Grades:
1st - 3rd
Types:
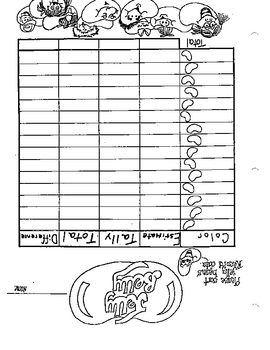
Jelly Belly Graph
You can give your students Jelly Belly Beans and then they can graph how many they have of each and then analyze the graph and answer questions about their findings.
Subjects:
Grades:
1st - 3rd
Types:
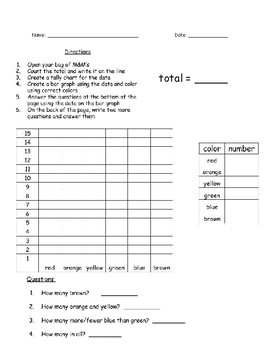
M&M Graphing Activity
Engaging activity for students to practice their graphing skills by collecting, recording, and analyzing data found in a fun size M&M bag!
Subjects:
Grades:
K - 2nd
Types:
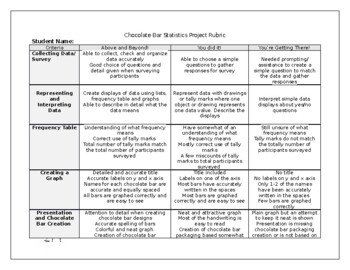
Chocolate Factory Statistics and Probability Project RUBRIC
An additional and more detailed rubric for the Chocolate Factory Statistics and Probability Project
Subjects:
Grades:
1st - 3rd
Types:
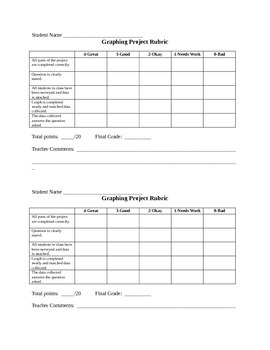
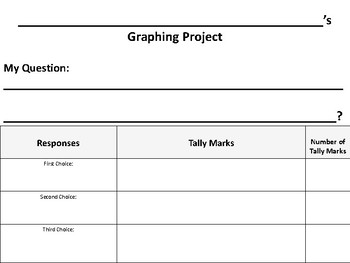
Graphing Project
Helpful to use for data collection, surveys, voting, statistics, and graphing math lessons.
Subjects:
Grades:
K - 3rd
Types:
Showing 1-9 of 9 results


