455 results
6th grade statistics projects
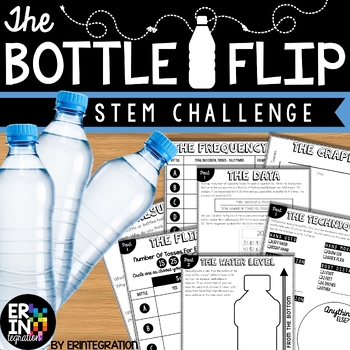
Water Bottle Flip STEM Challenge + STEM Activity
The ORIGINAL water bottle flip STEM activity and lab! Water bottle flip at school? Absolutely! Students will love this on-trend STEM challenge inspired by the popular YouTube water bottle flipping challenge where students toss a water bottle and attempt to land it straight up. Practice scientific method with some probability, fractions and data collection in the mix while having fun!This self-paced, low-prep, project based learning water bottle flip STEM challenge is print-and-go. Each activit
Subjects:
Grades:
3rd - 6th
Types:
CCSS:
NGSS:
K-2-ETS1-2
, K-2-ETS1-3
, MS-ETS1-2
, K-2-ETS1-1
, 3-5-ETS1-3
...
6th Grade Statistics Project: Analyzing Zombie Virus with Dot Plots and Mean
I created this project as a way for my 6th graders to practice their statistical skills. They loved it! They get to pretend to be epidemiologists studying a virus outbreak that is turning people into zombies. It's a fantastic way for students to see how statistics is used in the "real world" - they were also very interested to learn about the field of epidemiology. The Project: Students are given data about infected people who are quarantined in an airport. They are also given two maps of the US
Subjects:
Grades:
5th - 7th
Types:
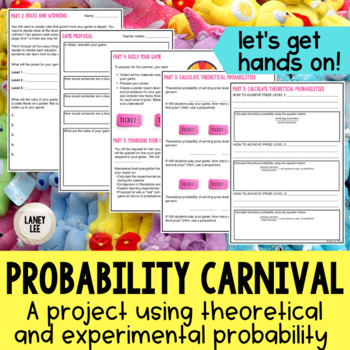
Probability Carnival Game Project - PDF & Digital
Looking for a fun, hands on way to bring probability to life? Are you ready to move past the "sit and get" style of whole group instruction? If you answered yes to either of those questions, then this resource is for you!Keep your students engaged and accountable with the interactive, versatile Probability Carnival! The steps of this project are designed to be rigorous and require students to predict, reflect, connect, and think critically about the situations being investigated.Using this proje
Subjects:
Grades:
6th - 8th
Types:
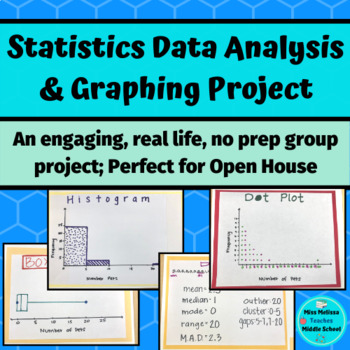
Statistics Project: Data Analysis & Graphing- real life, no prep
This statistics project is intended as a closure for your sixth grade statistics unit and aligns with ALL of the sixth grade statistics and probability common core state standards. In groups, students work together to choose a statistical question to ask the class. Once the class is surveyed, the group works together to create a frequency table, a dot plot, a histogram, and a box and whiskers plot. After creating their graphs, the groups analyze their data by looking at the mean, median, mode ra
Subjects:
Grades:
6th - 7th
Types:
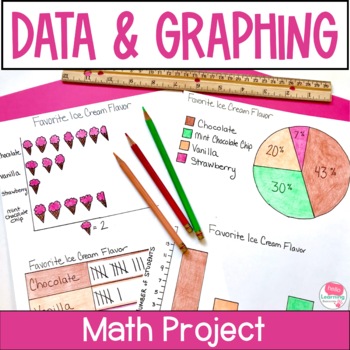
Data and Graphing Project - Real World Math Project Based Learning Activities
This data and graphing project gives your students a meaningful way to apply their data and graphing skills. Use this real world math project as an end of unit activity, enrichment activity or assessment. Easy to use and fun for students!Click the PREVIEW button above to see everything that is included in this fun math project!⭐ This resource includes:teacher information, directions and sample schedulesupply listgrading rubricstudent direction sheettwo data collection sheets (one for open ended
Subjects:
Grades:
4th - 6th
Types:
CCSS:
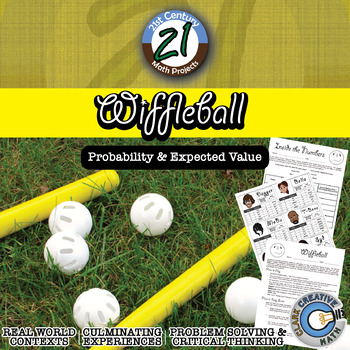
Wiffleball -- Theoretical & Experimental Probability - 21st Century Math Project
Theoretical and Experimental Probability gets a 21st Century Math Project facelift in this interactive game. Tired of flipping coins and spinning spinners? Students play the role of team managers and with only player statistics they must build a team capable of winning the championship. Students will plays a series of Wiffleball games where they will keep track of statistics using a baseball/softball inspired scorebook and after the game crunch the number to see if their players performed up to
Subjects:
Grades:
6th - 12th
Types:
Also included in: Probability & Expected Value Unit Bundle - Distance Learning Compatible
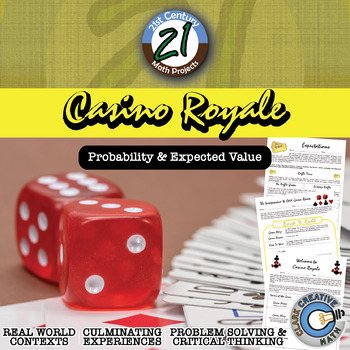
Casino Royale -- Expected Value & Probability Game - 21st Century Math Project
Your students might be begging for for a day for them to play games. Let it be on your terms in this 21st Century Math Project! This Expected Value and Probability Project focuses on one of the more emphasized aspects of the Common Core Standards. Students will be asked to design their own games with defined expected value and host it in a Game Day event! The student that collects the most "Swagg Cash" will forever (or at least for 36 hours) be known as the Master of Swagg. ***THIS PRODUCT HAS B
Subjects:
Grades:
6th - 12th
Types:
CCSS:
Also included in: Probability & Expected Value Unit Bundle - Distance Learning Compatible
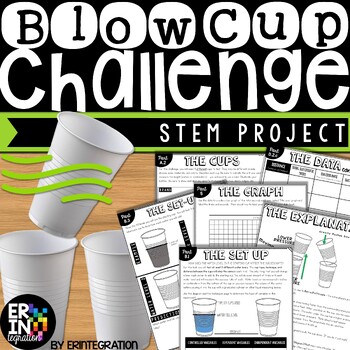
Blow Cup STEM Challenge and Scientific Method Project
The Blow Cup Challenge is now a STEM activity with this engaging science project inspired by the viral video where students try to blow one cup into another cup. Great low-prep way to teach the scientific method, variables and review math skills!This self-paced, multi-part Blow Cup STEM challenge is print-and-go. Each activity sheet guides students through the project. STEM Challenge Overview:Students will use the included visual directions, graphic organizers, charts, and activities to...Deter
Subjects:
Grades:
3rd - 6th
Types:
NGSS:
MS-PS2-2
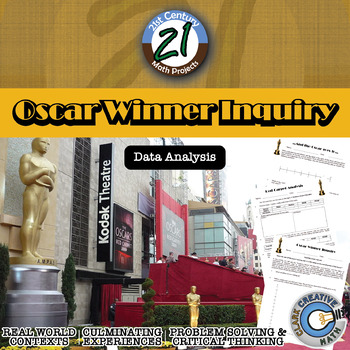
Oscar Winner -- Data Analysis & Statistics Inquiry - 21st Century Math Project
Utilize the last twenty years of Oscar winners as a data set to guide your students through creating box and whisker plots, histograms, and exploring mean, median, and mode -- in one 21st Century Math Project!Does the age of the award winning star in a film relate to the overall gross of the movie? Student will explore this inquiry question and use the data to support their conclusion.In this 8 page document you will be given a mapping to the Content Standards, an outline for how to implement t
Subjects:
Grades:
6th - 12th
Types:
Math Statistics Project Based Learning Dot Plot Box Plot Histogram
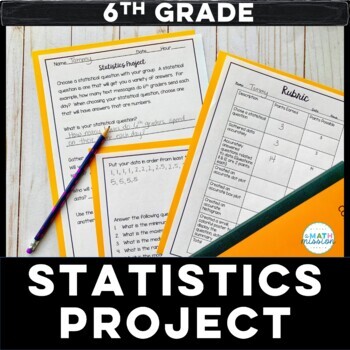
Set your students loose to practice their statistics skills! This project is great for a culminating assessment. This project is centered around students coming up with a statistical question, and gathering data on that question. Students answer statistical questions, and create a dot plot, box and whisker plot and histogram based on the data collected. A summary of their findings is then created to display for others to see. A rubric is included for grading purposes. This project actively
Subjects:
Grades:
5th - 7th
Types:
Statistics & Data Display Project for 6th Grade Math PBL (Fully Editable)
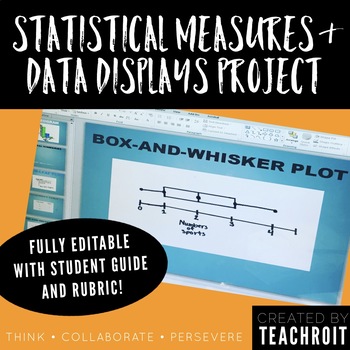
This product includes a student guide for a 6th grade middle school mathematics project that will require students to develop a statistical question, conduct a survey with their classmates, create numerical summaries, represent their findings using visual data displays, and finally present their findings! The thorough student guide provides step by step directions for each part of the project and could be used as either an in class project or to be assigned as homework. The student guide also in
Statistics Project - Statistics Olympics
Engage your students in their study of statistics as they compete in self-created Olympic style events. This project will engage students and help them discover meaning and apply concepts including measures of central tendency, quartiles, outliers, variance, standard deviation, z-scores, box plots, histograms, normal and skewed distributions. This project can be completed in approximately 6-8 days (50-min class periods) ** March 2023 Update **Visual updates to all slides and documentsRubric ali
Subjects:
Grades:
6th - 12th
CCSS:
Math March Madness Full Tournament Project {BUNDLE}
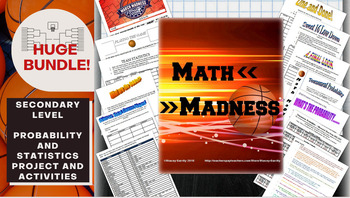
Harness the excitement of NCAA March Madness with this huge project for secondary math teachers that follows all stages of the tournament! This Common Core aligned bundle comes with bonus parts not sold individually in my store so you can create a rich immersion in the tournament, practice probability and statistics and learn some interesting new ones along the way! Save $3 plus get bonus content by bundling!You can pick and choose which parts you would like to incorporate, or follow my schedu
Subjects:
Grades:
6th - 12th, Higher Education
Types:
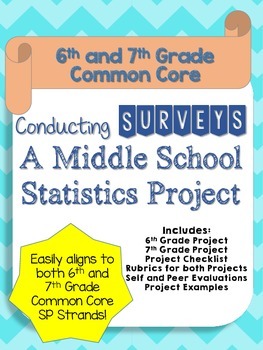
Statistics Project
This is a survey project that is aligned to the 6th and 7th Grade Common Core (6.SP.1 to 6.SP.5 and 7.SP.1 to 7.SP.4). Students survey a random sample and then calculate the mean, median, range, and mode of the data. They also must create different data displays such as histograms and box and whisker plots. This project is an all encompassing activity that gets students thinking about statistics and loving math! They prove their understanding of the topics by asking questions they are interested
Grades:
6th - 7th
Types:
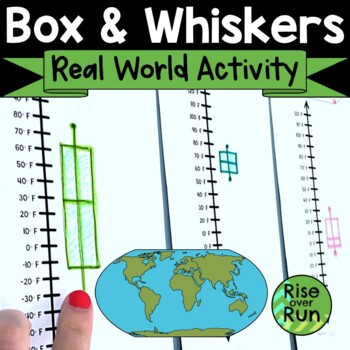
Box and Whiskers Plot Activity with Real World Data Comparisons
Help students understand how and why to use box & whiskers plots with this real world application using data about temperatures in different cities. Students use data about the highest average temperature for each month in a city. They locate it on a world map and then create a vertical box plot using the vertical number line provided. Once students create their individual cities’ box plots, all the data can be displayed on a wall for comparison. This leads to some great discussions about t
Subjects:
Grades:
6th - 7th
Types:
Also included in: Algebra 1 and 8th Grade Math Curriculum Bundle for Entire Year
Math Projects Middle School Bundle for STEAM
Jump into middle school math concepts with this Art meets math bundle of creative math projects. Great for math lab days or stations. 8 Math meets arts lessons + a bonus resource of linear equations with Calder ($45 VALUE). Each project includes:- Teacher's guidelines- Background information on artist- Student handouts for each part of the project- Answer key (where applicable)- Editable rubric (where applicable)- Slides or artwork related to projectThis bundle includes:- Rational vs. Irratio
Subjects:
Grades:
6th - 8th
Types:
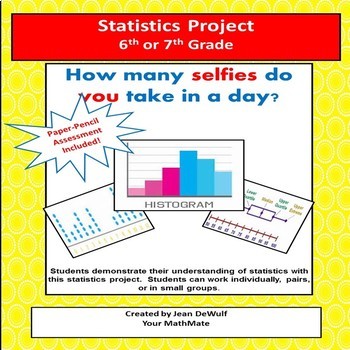
Statistics Project for 6th or 7th Grade! Bonus Assessment Included.
Your students are going to LOVE this interactive Statistics Project!You can choose either paper/pencil or digital formats for this project.Students can work individually, in pairs or in small groups.There are 5 parts to this project: Part I: Creating a Statistical Question Part II: Collecting Data & Determining the Measures of Center, Variation & 5 number summary. Part III: Creating 3 Graphs; a histogram, a dot plot and a box-n-whisker plot. Part IV: Written Description. Students will an
Subjects:
Grades:
6th - 7th
Types:
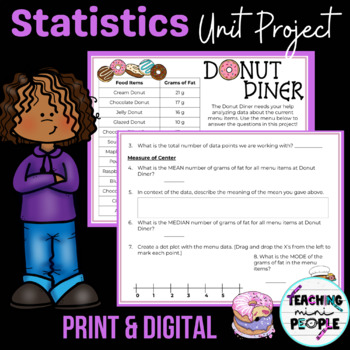
Statistics Project | 6th Grade Math Activity | Editable
This EDITABLE Statistics Unit Project is perfect for reviewing the unit with one set of data. Students use a donut shop menu to analyze grams of fat data. Students practice with histograms and dot plots, measures of center, measures of spread, and the shape of distribution. **This product has been updated to add an EDITABLE print version! You can now edit the numbers as well as the questions asked about the data. Included: ➜ Teacher directions➜ Print Version for Students➜ Digital Version for Stu
Subjects:
Grades:
5th - 7th
Types:
Also included in: 6th Grade Statistics | Measure of Center | Box Plots | 5 Number Summary
Mean, Median, Mode, and Range (Bundled Unit) - Distance Learning
This is an enjoyable, interactive, and engaging bundled unit covering mean, median, mode, and range (and introduces outliers). This unit is great for 5th and 6th graders and 7th graders who struggle with these concepts.Included in this bundled unit:PowerPointAnimated and fun 4-part, 21-slide PowerPoint (multi-day use)-Part 1 – The Meaning of Mean-Part 2 – Getting in the Middle of Median-Part 3 – Making the Most of Mode-Part 4 – Home, Home on the RangeEach section offers plenty of practice probl
Subjects:
Grades:
5th - 7th
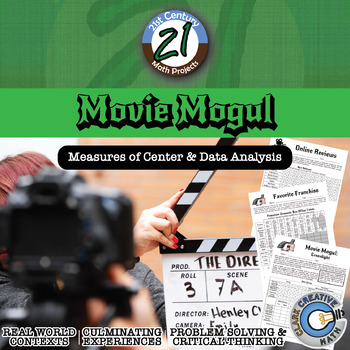
Movie Mogul - Mean, Median & Variation - Project - Distance Learning Compatible
Nowadays online reviews have a huge impact on business. Customer ratings help people decide what to buy and what products to avoid. Movies and entertainment are moving toward the world of intense data analysis of audience views to make business decisions. Companies like Amazon and Netflix have poured resources into developing original content. Let your students sit in the driver's seat! -- and practice Mean, Median and Variation in this 21st Century Math Project!In this 22 page document you will
Subjects:
Grades:
6th - 12th
Types:
Geometry: Survey and Circle Graph Project Made Fun!
Circle Graph Geometry Activity - Everyone just wants their piece of the pie!This is a fun, multi-faceted project that will have your students creating and implementing a survey, converting their results using various mathematical operations, and creating a poster-sized circle graph incorporating various geometry skills.This Survey and Circle Graph Project Unit Includes:PowerPoint:-Fun, interactive, 3-part PowerPoint slide presentation that walks you and your students through the entire project f
Subjects:
Grades:
5th - 7th
Skittles Statistics Project (6.SP.2, 6.SP.4, 6.SP.5)
Using a Fun Size Skittles Bag, students will make predictions as to the number of colors in each bag. They will then record the actual number of skittles of each color in the bag and convert those numbers into a fraction, decimal, and a percent. Using the class data, students will record the number of purple Skittles in each of their classmates' bags. They will use this data to find the mean, median, and mode, create a histogram, a dot plot (line plot), and box plot (box and whisker plot), find
Subjects:
Grades:
6th
Types:
Statistics Project - Middle School Math 6.SP
I designed this project to use a major grade instead of a test. This can be done individually, or in groups. I have included the data cards that I handed out to my groups, but feel free to have them gather their own data, or make up your own. The purpose of this project was to analyze the students’ abilities to create a box plot, a histogram, and a stem and leaf plot. They will have to figure out on their own that those are the three displays that will best fit the data I gave them.
This is al
Subjects:
Grades:
6th - 8th
Types:
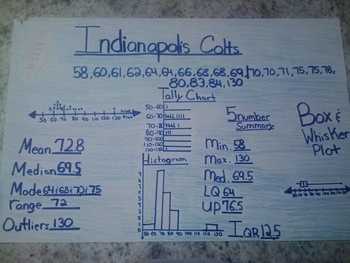
Favorite Sports Team: Data Displays and Measures of Central Tendency Project
Students will create a poster using sports statistics. Depending on the time of year, you may want to use football scores, basketball scores, data from the Olympics, etc. Students will use the internet (or you can print out statistics for them) to find sports data.
The students really buy into this project because it is about something they are interested in - their favorite sports team!
Students will display their knowledge of several data displays: line plot, tally chart, histogram and bo
Subjects:
Grades:
5th - 8th
Types:
Showing 1-24 of 455 results


