42 results
6th grade statistics laboratories

Candy Probability: Discovery of EXPERIMENTAL vs. THEORETICAL Probability
Middle Schoolers LOVE probability!
This is a GREAT lesson around Halloween when the kids are already hyped up on sugar and want to 'talk' to their classmates.
This activity allows the students to DISCOVER the differences between EXPERIMENTAL and THEORETICAL probability and connect it to everyday experiences. The probability lesson lends itself to fractions, decimals, percents, data collection, rational & irrational numbers, statistical graphs (box and whiskers, frequency tables...), measu
Subjects:
Grades:
5th - 9th
Types:
Theoretical vs Experimental Probability Lab (includes making predictions)
This is a fun, student-centered activity in which students working with a partner will conduct an experimental lab tossing 2 coins. After completing the lab, they will draw conclusions based upon the results of the activity concerning the difference between theoretical and experimental probability. Then they use experimental probability to make predictions. I have included the lab activity, a follow-up worksheet which can be used to engage student discussion after the lab, and a worksheet for
Subjects:
Grades:
6th - 9th
Types:
Water Bottle Flipping Investigation
Water bottle flipping- ratio, percent, measurement, data collection and graphing! The kids love bottle flipping and this product will let you bring bottle flipping into your classroom in an educational way!
Students will make predictions about the ideal water level in their water bottle that will result int he most successful flips. They will then record data about their bottle and conduct a variety of trials using different water levels to test their success with flipping their bottle at d
Subjects:
Grades:
5th - 7th
Types:
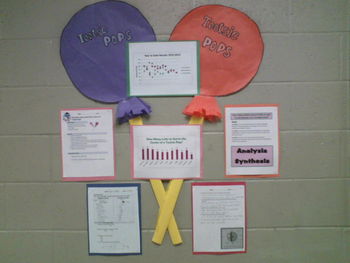
How Many Licks to the Center of a Tootsie Pop? Statistics!
Looking for novel way to get your middle school students excited about math and statistics?!
This file contains everything you need to conduct the experiment (except the Tootsie Pops!) that answers the age old question "How many licks does it take to get the center of a tootsie pop?" The lesson covers mean, median, mode, range, outliers, tables, graphs, box and whisker plots, data collection, pre and post discussion questions, experimental procedures, and student reflection. I also provided a s
Subjects:
Grades:
6th - 9th
Types:
Spring into Statistics Data Displays and Measures of Center Lab
This is a hands-on lab that teaches about Statistical Questions, Data Displays (dot/line plot, histograms, box plots) and Measures of Center (mean, median, mode, and range). The lab includes notes pages, examples with answer keys, and a final project in which the student can survey classmates and create a "flower" by using their data to find mean, median, mode, range. They will also create a box plot, histogram and dot plot.
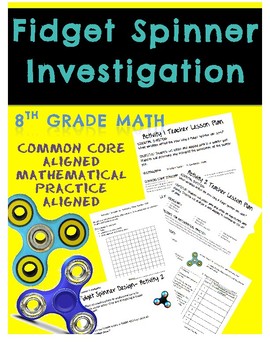
Fidget Spinner Math Investigation Scatter Plots and Data Displays
This pack contains two awesome activities involving the latest fad that is driving teachers CRAZY in middle school classrooms: FIDGET SPINNERS:
TWO Activities are contained in this pack!
Activity 1 is geared towards 8th grade students who have already studied scatter plots and interpreting correlations. In this activity students will collect data and compare the weight and time spinning of a fidget spinner. Materials required: scale, stop watch, and of course fidget spinners!
Activity 2 can b
Subjects:
Grades:
6th - 9th
Types:
CCSS:
Intro to Statistics Dice Game (with brief lesson)
This is designed to give students a very basic introduction to the world of statistics. They do not need any special knowledge to participate. After giving students a brief lesson how how statistics work, they will have fun experimenting with various dice games. This is fun for both students and teachers. Anyone can do it for any math class!
Subjects:
Grades:
6th - 8th
Types:
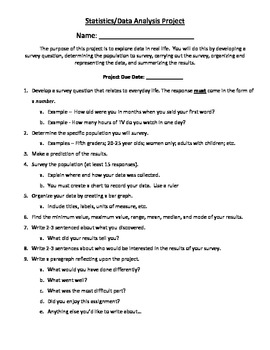
Real-Life Statistics Project
Students must think of a survey question that can be answered numerically. Then, they must go out into their community or school and ask at least 15 people their question. After collecting their data, they must find the minimum, maximum, range, mean, median, and mode. Also, they must graph their results, and answer a few reflection questions about their data.
I have my kids put all of this information on a poster or make a powerpoint presentation to show the class. I find this activity re
Subjects:
Grades:
4th - 8th
Types:
Basketball Statistics Project
Description: Engage your middle school students in the exciting world of basketball while reinforcing math and data analysis skills with this interactive Basketball Stats Project! This comprehensive resource is designed to captivate students' interest in both sports and mathematics, making learning both fun and meaningful.Take your students to the gym or outdoor playground hoop and they'll collect data on "How many baskets can ___ graders make in 60 seconds?" (the template is set to sixth grade
Subjects:
Grades:
5th - 8th
Types:
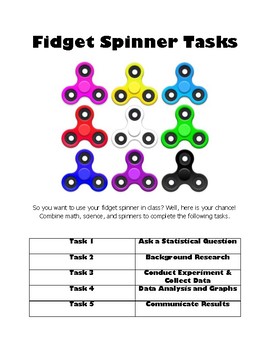
Fidget Spinner Tasks
This 5 part lesson combines math, science, and the fidget spinner craze! The five tasks incorporate 6th and 7th grade common core math standards in statistics and some geometry (area/circumference), along with the scientific method and writing.
Task 1: Ask a statistical question
-Includes identifying independent and controlled variables to design experiment fairly
Task 2: Background Research
-Includes drawing, describing qualities, calculating circumference and area of two circles, and weighing
Subjects:
Grades:
6th - 7th
Types:
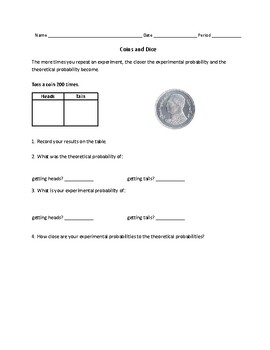
Pennies and Dice Probability Experiment - Statistics, Probability, and Data #9
In this hands-on activity, students will flip a coin and roll a six-sided die 200 times each to see if the results of their tests matches up with the hypothetical probability of each result.If you don't have coins or dice, there are online virtual versions of coins and dice.Assignment fits on one double-sided sheet.
Subjects:
Grades:
6th - 8th
Types:
Also included in: Middle School Statistics, Probability, and Data Bundle
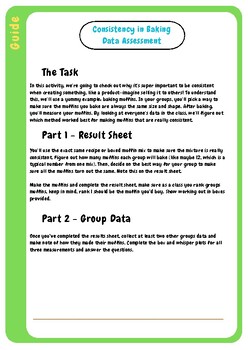
Consistency in Baking: A Data Story
This is a guide on how to use the consistency in baking results & group sheets. This is a statistics assessment:5 number summarymeanrange & IQRStandard deviationbox and whisper plotsYou don;t need to use this as an assessment but it's a great way to teach the importance of data and how it's useful in a commercial setting. This practical will also help students understand mean and standard deviation. i find that students know how to calculate mean, median and mode but no matter how many t
Subjects:
Grades:
6th - 10th
Types:
Probability Carnival Project
Using Mr. Naussbaum's probability fair website (a free, typically unblocked, math game), Students will play common carnival games and use the slides to answer questions about the probability of outcomes.
Subjects:
Grades:
6th - 8th
Types:
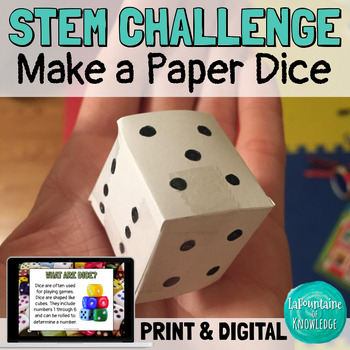
STEM Challenge Make a Paper Dice Geometry Lab Experiment PRINT and DIGITAL
In this STEM challenge, students create and test a paper die. They learn about dice and how their cube shape allows them to land on random numbers each time they are rolled. This hands on science lab activity incorporates geometry (3D shapes) and probability with engineering and design. This resource includes: teacher directions, discussion questions, and extension activitiesbackground information about dice and how they workan introduction to the challenge to get students starteda student respo
Subjects:
Grades:
3rd - 6th
Types:
NGSS:
3-5-ETS1-3
, 3-5-ETS1-1
, 3-5-ETS1-2
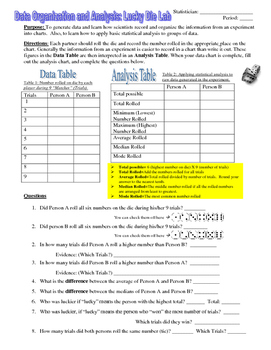
Data Organization and Statistical Analysis Activity: Lucky Die Lab
An engaging way for students to learn about how scientists generate data and make meaning of that data using statistical tools. Featured Concepts:Data Organization in TablesData Analysis Using Measures of Central Tendency: Mean, Median and Mode. NGSS Science and Engineering Practice: Using mathematics and computational thinkingMaterials needed in addition to the handouts: Dice (one per student dyad)Includes bonus second page featuring analysis of experimental design, with opportunities for fur
Subjects:
Grades:
5th - 8th
Types:
Statistics Activities Bundle
This bundle has 2 labs, 1 project, and a movie worksheet to Luca.
Subjects:
Grades:
6th - 10th
Types:
Fidget Spinners: Math in Motion
If a fidget spinner is better at holding a student’s interest than my math lesson, it’s not the fidget spinner than needs to go! Let’s use them to help the students see the math in their everyday life math in a fun and engaging way. Students will gather and interpret data, convert measurements of time, graph data, and even use online software if you wish.As a “S.T.E.M. in Action” lesson, you’ll find all four components of a true S.T.E.M. curriculum represented.Science — Students design an experi
Subjects:
Grades:
6th - 9th
Types:
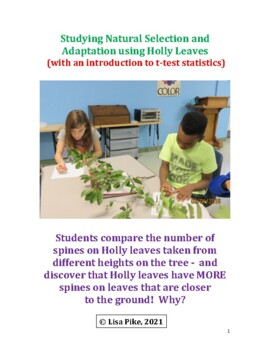
Holly Leaf Spines: an example of natural selection and adaptation
In this lab we will answer the question: Is the number of spines the same on leaves found at all heights on the Holly tree? Holly is just one example of the fluctuations in shape and form of an organism; the variation that any species can exhibit. It is important to recognize that this variation, or plasticity, is normal, and often relates to different environmental conditions (including competition and predation). The ability of an organism to change its characteristics in response to environ
Subjects:
Grades:
6th - 12th, Higher Education
Types:
NGSS:
HS-LS4-3
, HS-LS4-4
, MS-LS4-4
, MS-LS4-6
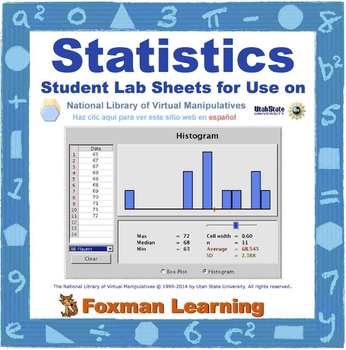
Statistics Graphs -- Virtual Manipulatives Lab for Middle School Math CCSS
This lab guides students through five of the statistics graphs virtual manipulatives (applets) from the nlvm website: Bar Chart, Pie Chart, Box Plot, Histogram, and Scatterplot. These virtual manipulatives are a great way for students to explore and compare various ways to represent data in a fun and conceptual format. My students really enjoy working through these labs and I enjoy the math understanding and discussions that follow. Five other nlvm labs for Middle School Math are available in M
Subjects:
Grades:
6th - 8th
Types:
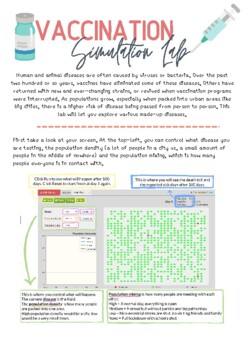
COVID-19 Simulation Lab
Students go to the following website and follow the guide to answer the questions. They look specifically at why social distancing and staying at home works, how population density affects the spread of a virus and how vaccinations can slow the spread. They will answer questions about their thoughts on vaccinations and if they should be required to have one. Website: https://www.learner.org/wp-content/interactive/envsci/disease/disease.html
Grades:
5th - 12th
Types:
NGSS:
HS-LS4-6
, HS-LS4-3
, MS-LS4-4
, MS-LS4-6
Mark Twain Common Core Math Activities Workbook Gr 6–8 Printable 9404235-EB
Hands-on lab activities in the Common Core Math Activities eBook allow students to explore mathematical concepts!• Centered around Common Core State Standards, this 96-page resource for grades 6 to 8 features hands-on activities that are designed to develop problem-solving skills. • From Wrapping Packages to Crime Scene Investigation, students will be challenged to pull from previous mathematical knowledge and extend it as they investigate mathematical relationships and concepts. • Teacher pages
Subjects:
Grades:
6th - 8th
Types:
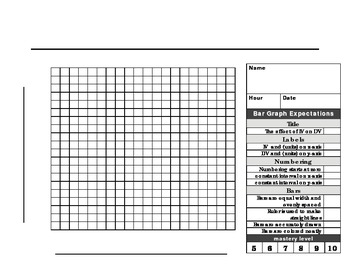
Bar Graph paper and rubric
This 20 X 20 graph paper with rubric is made for a beginner scientist to make a the perfect BAR graph. The checklist format makes it easy for students to know what is expected when graphing. Enjoy!
Subjects:
Grades:
1st - 12th, Higher Education, Adult Education
Types:
Heart Beat Statistics Lab
Students are comparing heart beats before and after exercising. This lab has students collecting, sorting, and comparing data.Included:Teacher page with description, materials needed, and directions.Student lab sheet
Subjects:
Grades:
6th - 10th
Types:
Also included in: Statistics Labs Bundle
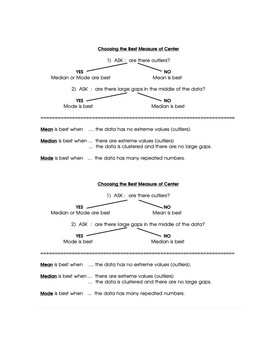
Best Measure of Center Notes and Lab
My 6th and 7th graders had a tough time deciding upon the Best Measure of Center. The notes, in flow chart form, help them to understand and make the best choice. The Math Lab is fun and requires few materials. It's important that the students keep their eyes closed since balance is aided by the sense of sight! The labshould take less than an hour to complete.
Subjects:
Grades:
6th - 7th
Showing 1-24 of 42 results


