2,633 results
7th grade graphing microsofts
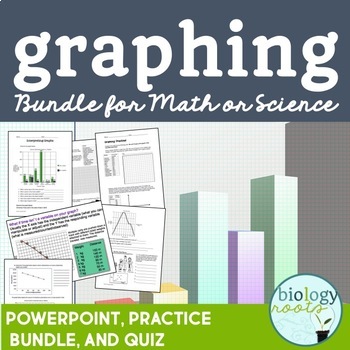
Graphing Bundle for Secondary
Complete and editable graphing bundle includes plenty of practice, editable PowerPoint notes to introduce or reinforce graphing concepts, as well as an assessment to finish it off! Suitable for grades 7 and up. Included in the package is:1. How to Interpret Graphs PowerPoint PresentationCovers line graphs, bar graphs, scatter plots and pie charts. Answers included on teacher version.Student notes included (PDF and PPT). 2. Interpreting Graphs- 3 pages of graph interpretation in which students an
Subjects:
Grades:
6th - 10th

Beaker Pong: Experimental Design and Graphing Lab, NGSS aligned
Great 1st week or 1st month STEM activity! All parts are EDITABLE and includes a graphing grid! This is a great way to introduce the "science process" (better phrase for scientific method) at the start of a semester or anytime you want fun to occur in your classroom.*****Focus on the NGSS PRACTICES Dimension*****The National Research Council's (NRC) Framework describes a vision of what it means to be proficient in science; it rests on a view of science as both a body of knowledge and an evidenc
Subjects:
Grades:
7th - 12th
Types:
Lucky Charms Cereal Data Analysis and Graphing Project St. Patrick's Day
Looking for a way to review data analysis and graphing skills without it being a bore? This Lucky Charms Cereal Data Analysis and Graphing Project is a fun activity to incorporate in March for St. Patrick's Day, but of course it works at any time of the year in a graphing unit or in a math-integrated unit. Your students will smile when you whip out the box of Lucky Charms and tell them that they are to pretend they are the Quality Control Department at the Cereal Company! This activity is fun an
Subjects:
Grades:
6th - 8th
Types:
NGSS:
MS-ETS1-4
ZONK! CCSS Graphing on the Coordinate Plane - Interactive Powerpoint Review Game
Students will love this ZONK review game! This game reviews graphing on the coordinate plane, coordinate plane vocabulary, finding distance between two points, graphing polygons, and finding perimeter and area after graphing on the coordinate plane.The students work together in teams to choose a number on the screen. When the button is clicked, most of the time a question will be revealed. However, if there is a ZONK behind that button, then the team will lose their turn. Even worse, if there
Subjects:
Grades:
5th - 7th
Also included in: Math Assessments and Review Activities BUNDLE for 6th Grade Common Core
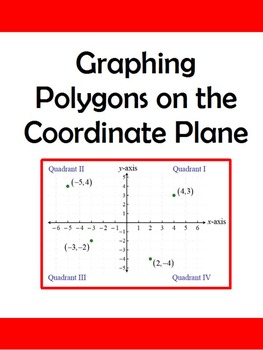
Graphing Polygons on the Coordinate Plane to Find Area/Perimeter
This activity asks the students to plot various ordered pairs on a coordinate plane and connect the points to make a polygon. Then they are expected to calculate the area and/or perimeter of each shape. The first worksheet has a square, two rectangles and a triangle. The triangle is starred to show higher level thinking. Each polygon is to be colored a different color. The second worksheet asks the students to plot the points of five polygons: a triangle, two rectangles and two composite f
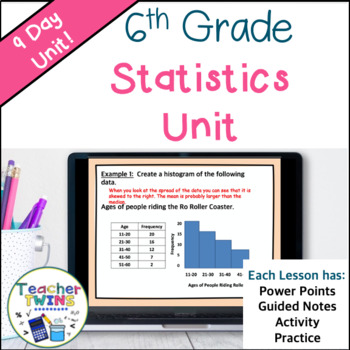
Statistics Unit Grade 6 - Mean - Median - Mode - Histograms - Box Plots
Make lesson planning easy with this no-prep Statistics - Mean, Median, Mode - Histograms - Box Plots Unit! Included are 9 ready-made lessons to teach finding the mean, median, and mode as well as interpreting and creating dot plots, histograms, and box-and-whisker plots. This unit is very easy to use and will save you a lot of time! Your students will learn how to find mean, median, and mode and interpret box-and-whisker plots by using our editable PowerPoints with guided notes. Students will lo
Grades:
5th - 7th
Also included in: 6th Grade Math Curriculum Bundle
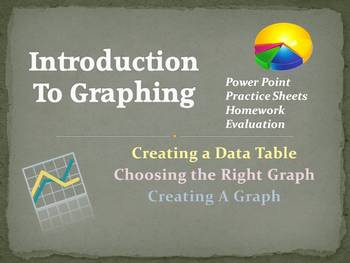
Data Tables and Graphing Introduction and Practice
Students need practice creating data tables and graphs. Students also need to be able to interpret existing graphs. This lesson introduces students to data tables and graphs, teaches students how to create data tables from data, how to interpret tables and graphs, and offers hands-on opportunities to create data tables and graphs.
A 29-slide Power point presentation introduces data tables and graphing skills, offered in both 2003 and 2007 versions of Power point. Accompanying work pages in P
Subjects:
Grades:
5th - 8th
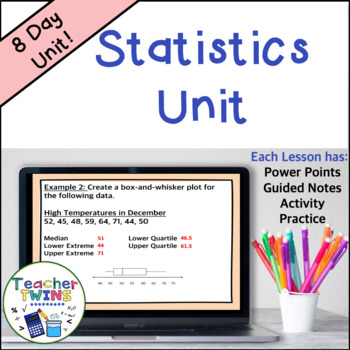
Statistics Unit - Mean Absolute Deviation - Populations and Samples - Box Plots
Make lesson planning easy with this no-prep Statistics - Mean Absolute Deviation - Populations and Samples - Box-and-Whisker Plots Unit! Included are 8 ready-made lessons to teach finding mean absolute deviation as well as interpreting and creating box-and-whisker plots. This unit is very easy to use and will save you a lot of time! Your students will learn how to find mean absolute deviation and interpret box-and-whisker plots by using our editable PowerPoints with guided notes. Students will l
Subjects:
Grades:
6th - 8th
Also included in: 7th Grade Math Curriculum Bundle
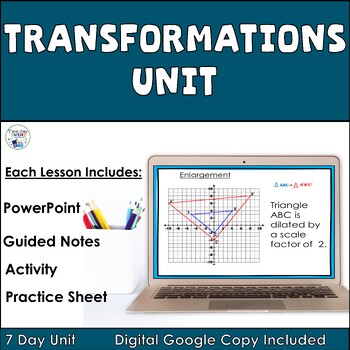
Transformations (Reflections, Rotations, Translations, Dilations) 8th Grade Unit
Make lesson planning easy with this no prep Transformations - Reflections, Rotations, Translations, and Dilations Unit! Included are 7 ready-made lessons to teach reflections, rotations, translations and dilations to your students. This unit is very easy to use and will save you a lot of time!Teach your students about reflections, rotations, translations and dilations by using our editable PowerPoints with guided notes. Students will love learning about transformations when you use the included
Grades:
6th - 8th
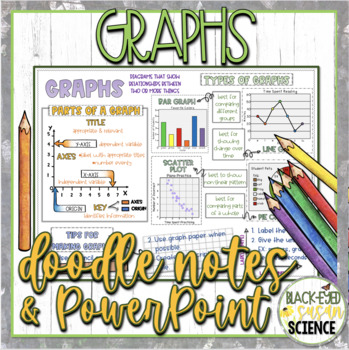
Graphs Doodle Notes & Quiz + Power Point
-DIFFERENTIATED CONCEPT NOTES -QUIZ -ANSWER KEYS -RIGOROUSDo your students love to doodle while taking notes? Don't fight it, embrace it with Doodle Notes (aka Squiggle Sheets)!!!These notes are not only fun but help students to meet Next Generation Science Standards.Notes are differentiated. 3 versions are included. Use the included answer key or choose to use the blank version to make the notes your own.Some things covered in these notes:parts of graphstipstypes of graphsbarlinecirclescatter
Grades:
6th - 8th
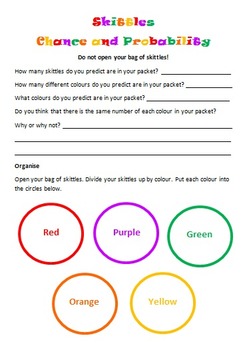
Skittles Chance and Probability (Editable)
Chance and Probability activity using yummy Skittles!!!
Students are to predict the colours and quantities before they open the skittles bag. Students are to complete a chance experiment where they use a tally to collect their data. Students then transfer their data in fractions, decimals and percentages. Students are to create a bar graph using their data as well as answer chance and probability questions about the data. I used this with my grade 5/6 students and they loved it!
Subjects:
Grades:
3rd - 10th
Types:
Coordinate Plane Amusement Park Project
This 11-page project packet is designed for students to create a "blue print" of their own amusement park. Packet also includes 3 pages of teacher directions/tips and a checklist. This is a culminating unit project to be used at the end of a unit on integers/graphing in the coordinate plane. By following the steps in each of five tasks, students create an amusement park using all four quadrants of the coordinate plane. Students demonstrate understanding of plotting points on the coordinate pl
Grades:
6th - 7th
Types:
Coordinate Graphing PowerPoint Lesson
Smile! You're Coordinate Graphing
This 32-slide PowerPoint presentation will have your students mastering how to graph x and y coordinates (2,3) in no time at all! Along with presenter SMILEY FACE, you students will learn how graph coordinate points, how to decide the correct coordinate points when given a point on the graph, and how to find the correct destination when coordinate points are given. Students are given so much opportunity for guided practice and independent practice, that they
Subjects:
Grades:
4th - 8th
CCSS:
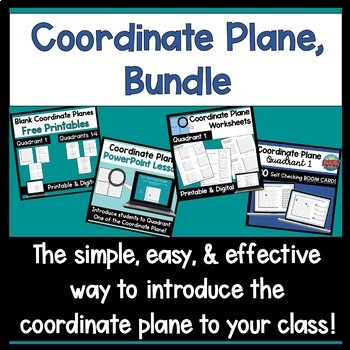
Coordinate Grid Quadrant 1 Bundle
This bundle deals mostly with quadrant one of the coordinate plane.The resources include:Free Blank coordinate planes/coordinate grids in printable and digital formatsIntroduction to Coordinate Graphing PowerPointPrintable & Digital Coordinate Plane Quadrant 1 WorksheetsCoordinate Plane Quadrant 1 Boom CardsBuy these in the bundle to get them at 30% off!*While the title says "Quadrant 1 Bundle," the printable worksheets include one page on quadrants 1-4 and the digital worksheets include thr
Grades:
5th - 7th
Blank Bar Graph/Double Bar Graph Template
This is a bar graph template that can be used by teachers to teach students how to understand bar graphs and create their own bar graphs. Teachers can use this template teach students about parts of a bar graph and how to interpret data in bar graphs.
Grades:
1st - 12th
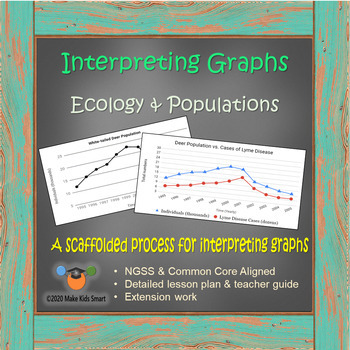
Interpreting Graphs - Ecology & Populations (17 slide Distance Learning Packet)
Teach students how to analyze and interpret line graphs, describe trends, and discuss data using a proven 5-step process. This is 2-3 periods of work suitable for distance learning and meant to move gradually from teacher led to independent work.All materials are found within this 17 page editable power point which is suitable for distance learning. Slides can be shared individually for student completion or shared as a full packet.Please check the preview to see exactly what you are downloading
Subjects:
Grades:
6th - 12th
NGSS:
HS-LS2-7
, MS-LS2-2
, MS-LS2-5
, HS-ESS3-2
, MS-LS2-4
...

Iditarod Bundle UPDATED (Overview, Presentation, Worksheet, Data Collection)
Iditarod Bundle (Timeline, Overview, Presentation, Worksheet, Data Collection)This bundle is everything you need to get started to teach about The Last Great Race on Earth, the Iditarod (the Alaskan sled dog race) in your class. It is an UPDATED, COMPLETELY DIGITAL & EDITABLE PRODUCT WITH INCLUDED PRINTABLES AND INTERACTIVE PAGESBegin by displaying an Iditarod timeline in your classroom and teaching students some geography and map skills about Alaska. Follow up w/ an overview presentation of
Subjects:
Grades:
3rd - 7th
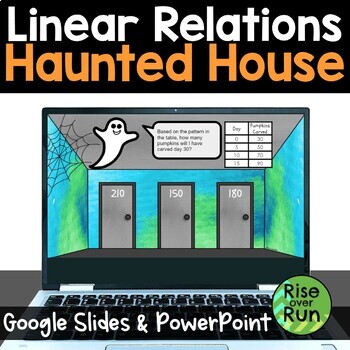
Digital Linear Relationships Halloween Escape Room Activity
Students will love this engaging practice activity for linear relationships. They must try to escape a haunted house! Includes Google Slides and PowerPoint versions. They are given 14 problems to solve, choosing from 3 possible answers for each one. If they solve correctly, they will choose the correct door and avoid the scary giant spiders! If they make a mistake, a spider appears, and they are prompted to try again. Problems include linear graphs, table of values, equations, and stories. Thi
Grades:
7th - 9th
Types:
CCSS:
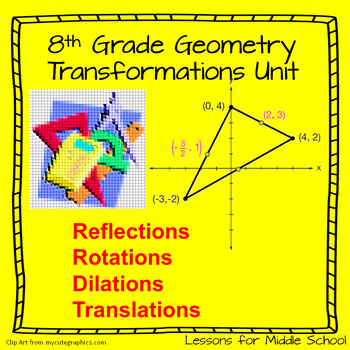
8 Grade Math - Reflections, Translations, and Rotations Geometry Unit
This is a COMPREHENSIVE unit for teaching students all of the 8th Grade Geometry COMMON CORE STATE STANDARDS associated with Dilations, Translations, Reflections, and Rotations. ABSOLUTELY NO PREP REQUIRED, just download and start teaching in minutes. This lesson is part of our Geometry Bundle for 8th grade that includes 9 weeks of lessons.LESSONS INCLUDED➯2 Lessons on Translations➯4 Lessons on Reflections➯6 Lessons on Rotations➯1 Review Lesson➯1 Dilations Project➯3 Formative Assessments*****
Subjects:
Grades:
7th - 9th
NGSS Intro to Graphing Crosscutting Concepts Science & Engineering Practices
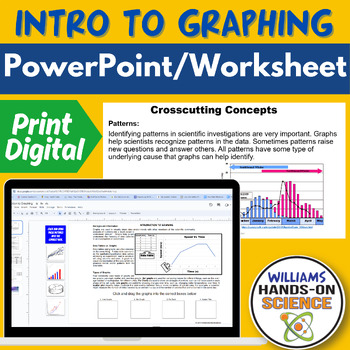
If you are teaching your students how to understand graphs and want to hit NGSS Science and Engineering Practices and Crosscutting Concepts, this resource is a great scaffold or lecture! This resource is great as a warm up/bell ringer, lecture, homework or sub plan.This resource includes the following:-Student Handout-Key-Editable PowerPoint for lecture and/or scaffold This resource includes the following Concepts:-Interpreting Graphs-How to make a graph-Difference between data tables and graph
Subjects:
Grades:
6th - 12th
Scientific Method Variables and Graphing Practice
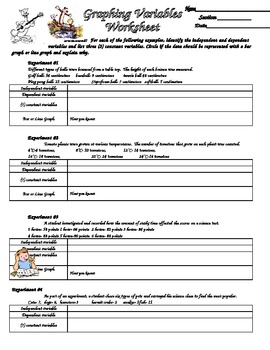
Students are given six different sets of experimental data and asked to identify the variables (independent, dependent etc.). They also reinforce graphing by identifying if the data should be represented with a bar or line graph. With this information, students the create data tables and graphs for the data.
Subjects:
Grades:
3rd - 12th
Types:
Box and Whisker Plots Real World Math Middle School Math
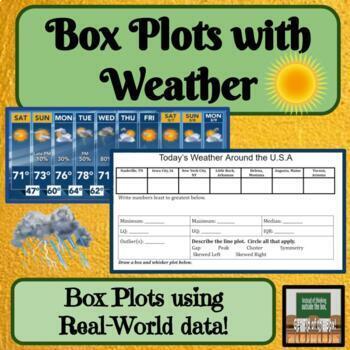
About this Resource:Students use current weather data from all over to create box plots using measures of variation. This is a create way to tie in some live science data! Topic Covered:*Measures of Variation/Variability*Describing Graphs*Box Plots / Box-and-Whisker Plots Ways to use this product in your classroom:-project-assessment-independent or partner work✓ Teacher Tested✓ Student Approved*This product has been used in my classroom and enjoyed by my students!Other products with similar con
Subjects:
Grades:
6th - 8th
Types:
Also included in: Box and Whisker Plots Line Plots Measures of Center Bundle Activities
Reflecting Points and Shapes over the Axes
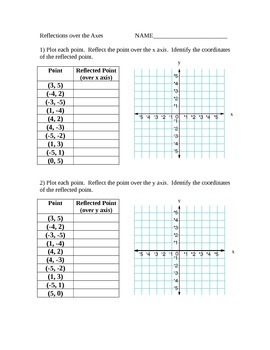
This worksheet gives students an opportunity to practice reflecting points and shapes over the x and y axis. Students explore that a reflection has on the impact on x and y values of a point. There are 20 problems on reflecting points and 4 problems on reflecting triangles.
Grades:
5th - 7th
Types:
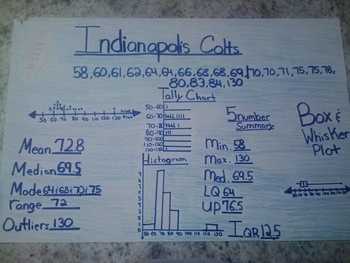
Favorite Sports Team: Data Displays and Measures of Central Tendency Project
Students will create a poster using sports statistics. Depending on the time of year, you may want to use football scores, basketball scores, data from the Olympics, etc. Students will use the internet (or you can print out statistics for them) to find sports data.
The students really buy into this project because it is about something they are interested in - their favorite sports team!
Students will display their knowledge of several data displays: line plot, tally chart, histogram and bo
Subjects:
Grades:
5th - 8th
Types:
Showing 1-24 of 2,633 results


