730 results
Elementary statistics lessons
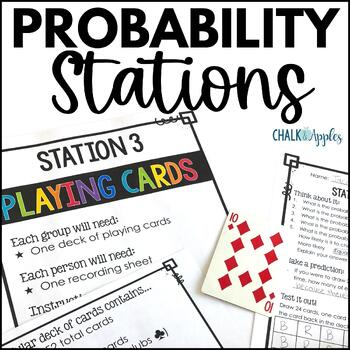
Chance & Probability Activities: Hands-On Theoretical & Experimental Probability
Make teaching probability exciting with these hands-on fun probability activities! This set includes 6 low-prep chance and probability stations perfect for exploring theoretical and experimental probability and critical thinking. Quick and easy setup plus clear student directions make these activities perfect for centers or substitute days, too!Lead your students to discover concepts of probability by exploring it on their own before teaching probability rules. Students will love exploring proba
Subjects:
Grades:
5th - 7th
Types:
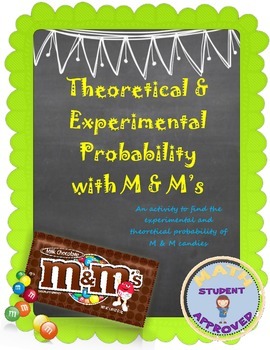
Theoretical and Experimental Probability M&M activity
Students need to find the probability of picking certain colored M&Ms, and asked to change them into decimals, fractions, and percents. They are asked to draw specific M&Ms at random for experimental probability problems. They are asked to make a few predictions, as well. This is a lengthy lesson and takes a while to get through, so make sure you have enough time to get through it. It can be done in 2 days, and if you need to use colored chips or counters instead, go for it!
Subjects:
Grades:
5th - 11th
Types:
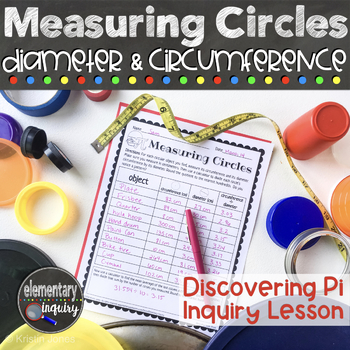
Measuring Circle Circumference & Diameter to Discover Pi - Pi Day Inquiry Lesson
Have fun finding Pi by measuring the circumference and diameter of circles of all sizes! Students will calculate the ratio of the length of a circle’s diameter to its circumference. They’ll discover that the circumference is always a little more than three times as long as the diameter. This full lesson plan and teacher script will help you lead an inquiry based investigation and class discussion. It’s perfect for an introduction to these geometry concepts, or for a fun Pi Day activity.A full, f
Subjects:
Grades:
5th - 7th
Types:
CCSS:
Also included in: Pi Day Activities - Measuring Circles Diameter, Circumference, and Area
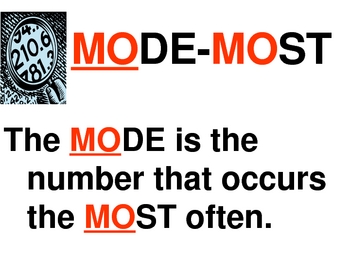
Statistics Mean, Median, Mode & Range Interactive PowerPoint by Erica
Introduce statistics including mean, median, mode and range with this colorful, interactive 22 slide PowerPoint. This interactive PowerPoint introduces each term and teaches a strategy for finding the value. There is also a trick or visual to help students remember the steps to find each one (mean, median, mode and range). Students are able to practice finding the mean, median, mode and range and then check within the PowerPoint. This is excellent for a statistics lesson or for students to e
Subjects:
Grades:
3rd - 6th
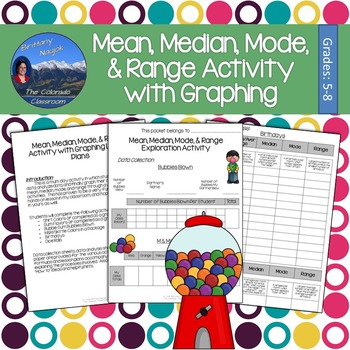
Mean Median Mode and Range Exploration Lab & Graphing Activity
Mean, median, mode, and range are explored in this activity lesson pack complete with lesson plans, student packets, and graphing pages. You and your students will tackle these four important measures of central tendency through a fun lab activity involving bubble gum, M&Ms, birthdays, dice, and more. Students will collect data, analyze their data, and then graph their results all while learning about the mean, median, mode, and range of various scenarios.This activity is prepared and read
Subjects:
Grades:
5th - 8th
Types:
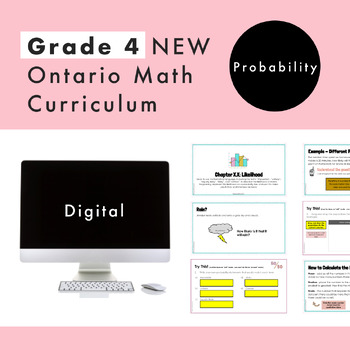
Grade 4 Ontario Math - Probability - Digital Google Slides + Form
Are you planning for the NEW Grade 4 Ontario Math Curriculum? This editable Google Slide and Google Form resource is what you need! This resource is for the DATA strand and and covers specific expectations for “D2. Probability”. In this resource, students will experience math through engaging real-life questions, storytelling through math, and interactive slides. What’s Included2 Google Slide presentations45 UNIQUE and EDITABLE Google Slides in totalSlides are editable for you to increase stud
Subjects:
Grades:
3rd - 5th
Types:
Also included in: Grade 4 NEW Ontario Math Curriculum Full Year Digital Slides Bundle
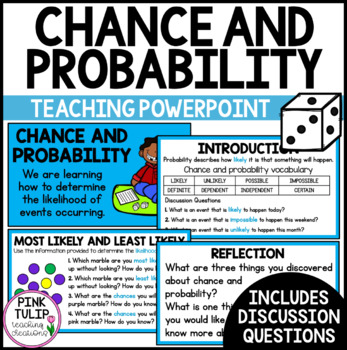
Chance and Probability - Teaching PowerPoint Presentation
Chance and Probability - Teaching PowerPoint PresentationCurriculum aligned PowerPoint presentation to guide explicit teaching of chance and probability, including likelihood. Includes:Learning intention.Introduction (tune in). Engaging graphics.Detailed explanations of various chance events.An in-depth vocabulary of terms such as likelihood, probability, chance, independent, dependent, and impossible.Discussion questions with answers.Reflection slides.Glossary. US spelling and UK spelling vers
Subjects:
Grades:
3rd - 5th
Also included in: Math PowerPoint Presentations Bundle
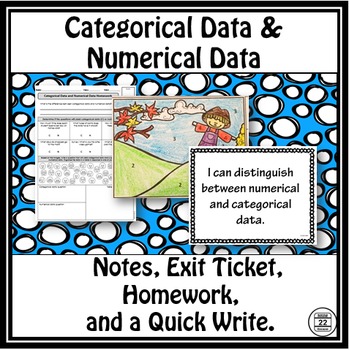
Categorical Data and Numerical Data
Are you planning an introduction to variability unit? Want a fun lesson on generating statistical questions? These categorical data and numerical data guided notes, exit ticket, homework, and writing prompt focus on distinguishing between data through word analysis and generating statistical questions.These materials will engage kids as they learn about this important math concept. Answer keys are included.
(1) Guided notes: information that gets straight to the point in easy-to-understand lang
Subjects:
Grades:
5th - 7th
Types:
5th Grade Data and Line Plots, 30 Enrichment Projects and 30 Test-Prep Problems
No-prep, 5th grade line plots and data math practice with 30 enrichment projects and 30 review test-prep questions aligned to the 5th grade math standards. A great way to teach the data standards in a fun, engaging way. Perfect for early finishers, advanced math students or whole class practice. Print and go math enrichment! These work perfectly for distance learning as well.This resource is aligned to the 5th grade math CCSS standards: 5.MD.B.2. (However, this resource is perfectly suitable t
Subjects:
Grades:
5th
Types:
CCSS:
Also included in: 5th Grade Math Projects For Every Standard! Enrichment All-Year Bundle!
Experimental Probability and Theoretical Probability - Experiments of Chance!
Probability is so frequently used in every-day life, yet so often under-explored as a common core subject in math classrooms. This is the first in a series of products which bring probability to life in upper elementary and middle school classrooms. Experiments of Chance gives students an introduction to experimental and theoretical probability by providing:- A warm-up problem via which the students review necessary prior knowledge and begin to think about the different components of probabili
Subjects:
Grades:
5th - 8th
Types:
Box and Whisker Plot PPT and Guided Notes 6.SP.2 , 6.SP.4 , 6.SP.5
Box and Whisker Plot
This PPT lesson teaches students the vocabulary that goes with box and whisker plots as well as the steps for creating a box and whisker plot.
Along with the PPT are guided notes where students can answer questions while watching the PPT as well as the answer key. They also have the chance to create their own box and whisker plot. This is a great introductory lesson. This matches Common Core Standards for 6th grade, but could be adapted and used for other grades as we
Subjects:
Grades:
5th - 8th
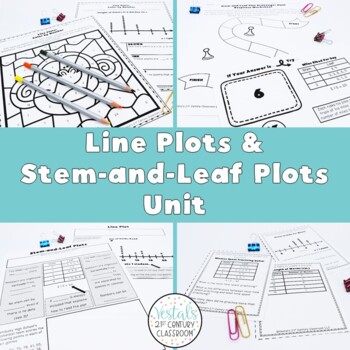
Line Plots and Stem-and-Leaf Plots Lessons (Math SOL 5.PS.1)
Are you looking for no-prep lessons and activities to teach line plots and stem-and-leaf plots? Look no further! These Line Plots and Stem-and-Leaf Plots Lessons provide everything you need to teach creating, interpreting, and comparing line plots and stem-and-leaf plots. Save time planning and your students will love completing the hands-on activities found in this unit.To take a closer look at some of the things included in this unit, check out the preview!What will students learn through thes
Subjects:
Grades:
5th
Types:
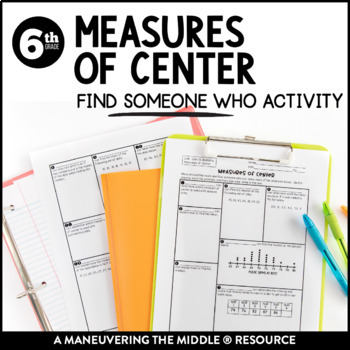
Measures of Center Activity | Mean and Median Activity | Data, Tables, Dot Plots
This Find Someone Who Measures of Center Activity is an awesome hands-on activity that is easy to prep! Students love being able to get up and move around the classroom and are more engaged and attentive than book work or a simple worksheet. This activity focuses on determining the measure of center (mean and median) from data, tables, and dot plots. Students are able to practice and apply concepts with this measures of center activity, while collaborating and having fun! Math can be fun and int
Subjects:
Grades:
5th - 7th
Types:
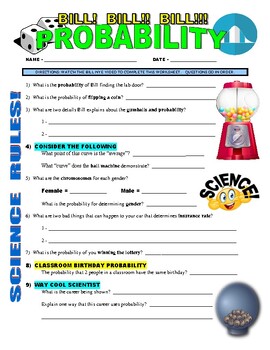
Bill Nye the Science Guy : PROBABILITY (STEM / math video worksheet / sub)
*Video is needed for completion of this product*Please make sure you have access to the video prior to making your purchaseWant more BILL! BILL!! BILL!!! – CLICK HERE!*This worksheet can be used to accompany the Bill Nye video PROBABILITY (Season 4, Episode 8).The worksheet has a series of questions that help students stay focused on various science facts about PROBABILITY. Areas covered: percentages, how probability is used in the world, math-science facts, and simple hands-on games and activit
Subjects:
Grades:
5th - 8th
Types:
Food Waste and Mathematics: From Farm to Table to Dump
Here's a very uncomfortable fact: it takes 4 pounds of potatoes to make 1 pound of potato chips. That means that for every 1 pound bag of potato chips you eat, 3 pounds of potatoes have to be thrown away. What a waste of food! This is a series of activities that looks at the hidden world of food waste. It includes a look at how much food is wasted as it is "processed" into finished products like french fries and potato chips. It also includes mathematical activities where students calculate how
Subjects:
Grades:
5th - 12th, Adult Education
Types:
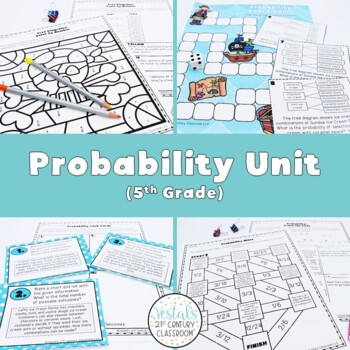
Probability Unit Plans (Math SOL 5.PS.3) {Digital & PDF Included}
Are you looking for no-prep lessons and activities to teach probability and sample spaces? Look no further! These Probability Unit Plans provide everything you need to teach probability with tree diagrams, lists, charts, and the Fundamental (Basic) Counting Principle. Save time planning and your students will love completing the hands-on activities found in this unit.To take a closer look at some of the things included in this unit, check out the preview!What will students learn through these de
Subjects:
Grades:
5th
Types:
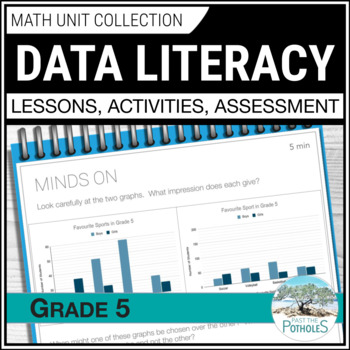
Data Management Unit: Reading Graphs Collecting & Analyzing Data Infographics
Save time and reduce stress!! This UPDATED Data Literacy unit has EVERYTHING YOU NEED. Students will learn about reading graphs, collecting data, analyzing data, misleading graphs, averages, and more. It includes 3-part Google Slides lessons, worksheets, games, centres, assessments, and report card comments.LOCK IN THIS PRICE! **You will have FREE LIFETIME UPDATES for any future updates and additions.**Lesson topics: ❉ Collecting Data using Sampling techniques ❉ Organizing Data using frequenc
Subjects:
Grades:
5th - 6th
Types:
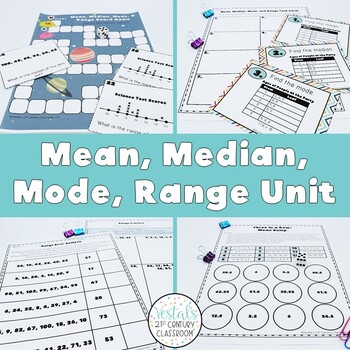
Mean, Median, Mode, Range Lessons (Math SOL 5.PS.2) {Digital & PDF Included}
Are you looking for no-prep lessons and activities to teach mean, median, mode, and range? Look no further! These Mean, Median, Mode, Range Lessons provide everything you need. Save time planning and your students will love completing the hands-on activities found in this unit.To take a closer look at some of the things included in this unit, check out the preview!What will students learn through these detailed lesson plans?4 Detailed lesson plans are included to help students learn and practice
Subjects:
Grades:
5th
Types:
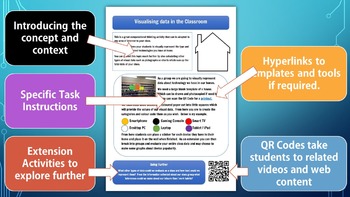
Computational Thinking & Data Analysis Task Cards | STEM | Digital Technologies
Most kids don’t naturally think like PROGRAMMERS, but you can enjoy the satisfaction of seeing them have a COMPUTATIONAL THINKING ⚡“A-ha!”⚡ moment as they learn with these visual, hands-on, NO PREP STEM activities.For those students who learn best by seeing, doing, and getting their hands dirty, this activity and card set will make abstract computing concepts as real as the classroom they’re sitting in. This pack uses students’ everyday interests, such as sports and friends, to teach them how al
Grades:
3rd - 8th
Types:
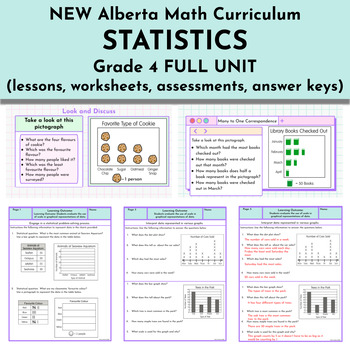
Statistics Unit - NEW Alberta Math Curriculum Grade 4
This Grade 4 Statistics resource is intended to meet the NEW 2023 Alberta Math curriculum expectations. Learning Outcome: Students evaluate the use of scale in graphical representations of data.Skills and Procedures:Engage in a statistical problem-solving process.Select an appropriate scale to represent data.Represent data in a graph using many-to-one correspondence.Describe the effect of scale on representation.Justify the choice of graph used to represent certain data.Compare different graphs
Subjects:
Grades:
4th
Types:
Also included in: FULL YEAR Alberta Math Curriculum - Grade 4
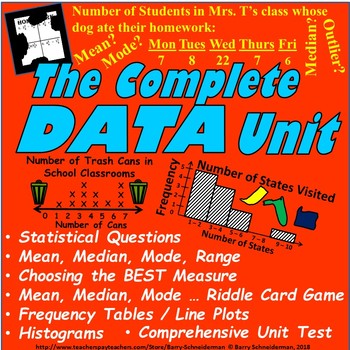
Mean, Median, Mode, Range, Line Plot, Histogram & More Data and Statistics Unit
Mean, median, mode, range, frequency tables, line plots, histograms, statistical questions, determination of the best measure of center, discussion of the impact of outliers .. real-world data and statistics concepts that we often find we are attempting to cram into our curriculum at the end of the school year. This complete data unit, which can be used at any time throughout the year, was created to help reduce this anxiety! In six to eight days, it comprehensively and, using an enjoyable, ea
Subjects:
Grades:
5th - 8th
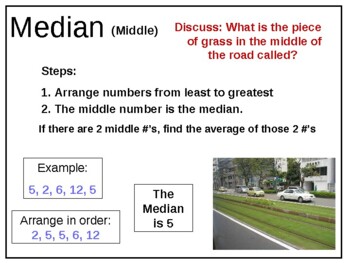
4th 5th 6th Grade Math Mean Median Mode Range MMMR Data Gr 4 5 6 Whole Numbers
This 16-slide Math PowerPoint introduces Mean, Median, Mode and Range and gives hints on how to remember each term. There are numerous practice problems as well. The numbers (data) used may be smaller than you desire, but the numbers are easily changeable and you'll still be able to use the examples. The last slide gives directions for a game to practice Mean, Median, Mode and Range using playing cards.
Subjects:
Grades:
4th - 6th
CCSS:
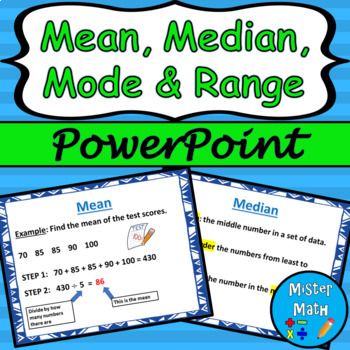
Mean, Median, Mode & Range PowerPoint Lesson
This is a PowerPoint Lesson to assist students in learning about finding the mean, median, mode, and range of data sets. The PowerPoint includes key vocabulary, as well as an example for each skill. Plenty of real-life examples are included to give students ample opportunities to connect the skills to the real world. The presentation also comes fully animated, with animations triggered by mouse click (or presentation pointer!)This PowerPoint lesson is also part of a BUNDLE that includes a guided
Subjects:
Grades:
3rd - 6th
Also included in: Mean, Median, Mode & Range PPT and Guided Notes BUNDLE
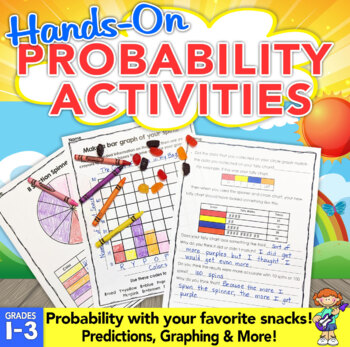
Probability Activities: Hands-On Probability with Snacks!
Probability activities are fun and engaging when you add treats! These fun probability activities allow students to experiment with probability using snacks.Students will use probability to predict, investigate, record data, and learn to use words to describe the chances of something happening.Students will love these probability activities because they are using skills with snacks! Each of the probability activities builds on each other and guides them step-by-step. Easy prep to print off the p
Subjects:
Grades:
1st - 3rd
Types:
Showing 1-24 of 730 results


