48 results
Statistics graphic organizers for Microsoft Word
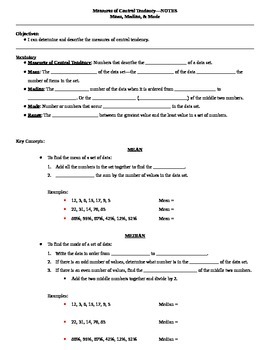
Measures of Central Tendency Guided Notes
These are guided notes for a lesson on measures of central tendency including mean, median, mode, and range. There are several examples in the notes and the same data sets are used to show each measure of central tendency.I have also included a teacher key to show you what to fill in the blanks as your students follow along.To use these notes, I simply projected them onto my whiteboard, gave the students their blank copies, and had them follow along and write what I wrote. This works great when
Subjects:
Grades:
5th - 12th
CCSS:
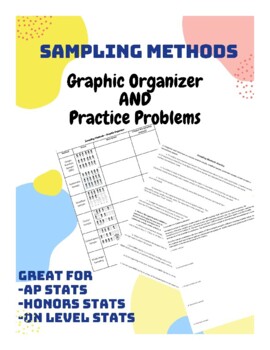
Sampling Methods Graphic Organizer and Practice - AP Statistics, Prob & Stats
This completely editable word document contains everything you need to introduce and practice the different types of Sampling Methods required in the College Board CED for the AP Statistics Course. The first portion of this download is a graphic organizer where students notate on top of a visual of the sampling method, define the sampling method, and then critique the sampling method. The next two pages contain practice where students start by identifying the sampling method used, and then fini
Subjects:
Grades:
10th - 12th
CCSS:
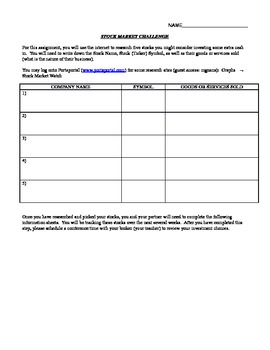
Stock Market Challenge Information Sheet
This document provides students a place to record the information they have gathered from their Stock Market research. It includes a place for students to record their stocks' 52-week high and low, dividends paid, does the company produce goods or provide services, as well as the reasoning as to why your student chose to purchase that particular stock. There are enough recording sheets for 5 stocks. This is a great way to teach students how to record and organize information for later use. If
Subjects:
Grades:
4th - 7th
Types:
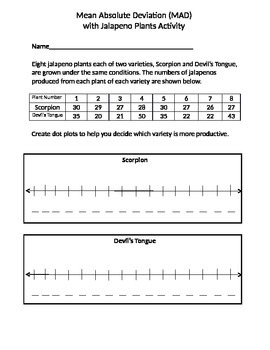
Mean Absolute Deviation Activities involving Jalapenos & Dice
Two Hands-On MAD activities are included: one involving jalapeno pepper plants and the other rolls of a die. Each activity guides students through the process of calculating and understanding MAD using graphic organizers to determine means, create dot plots, calculate Mean Absolute Deviation, and then analyze the data with a thought provoking open ended question for the jalapeno activity. Directions and accompanying graphic organizer guides the student step by step.
Subjects:
Grades:
6th - 7th
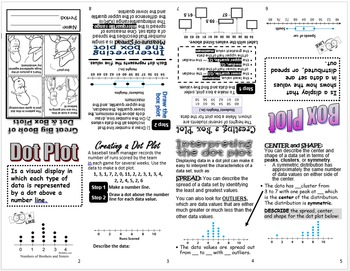
8 Page Mini Book Dot Plots and Box Plots
Use this 8 page mini book for dot and box plots intro. This can be used for 6th and 7th grade Texas TEKS. 7.12 and 6.12A
Subjects:
Grades:
6th - 7th
Types:
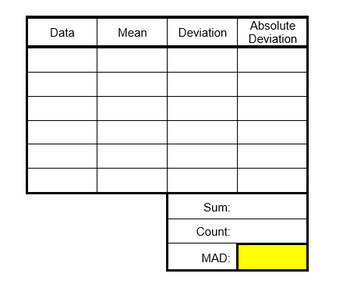
Mean Absolute Deviation Tables
These tables are to guide students through the steps of solving Mean Absolute Deviation problems. They can be used for initial note-taking, guided practice or long term support. There are 6 on a page but they are in a MS Word format so can be edited as needed. Each currently has space for 6 data points to make them seem less overwhelming but it is easy enough to insert/delete rows and make them exactly what you need. If you have any questions about editing it, please let me know and I'll be happ
Subjects:
Grades:
6th - 8th
CCSS:
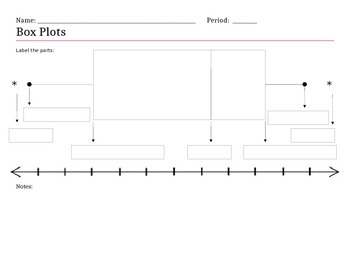
Box and whisker plot notes Graphic Organizer (Editable)
This document is a word file so you can edit it how you want. You can change the font, add graphics, even color-code it if wanted.
This graphic organizer is one that I designed to help my students easily identify the parts of the box and whisker plot. This is good to help introduce the concept and have the students glue in their notebook.
I made a poster size one and had them copy the notes I made. I really recommend color coding it helps them see a difference.
I left the NOTES section
Subjects:
Grades:
6th - 7th
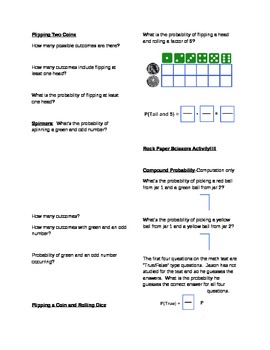
7th grade Common Core Compound Probability Notes Page
This notes page accompanies the Compound Probability Smart-board lesson
Subjects:
Grades:
7th
Types:
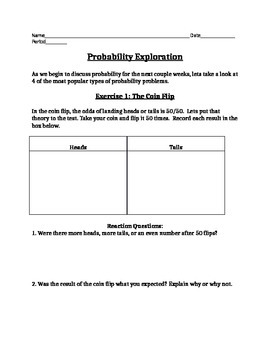
Probability Exploration - Editable
This activity is designed as an introduction to the four most popular types of probabiltiy studied, and is intended to have students make connections between their results and the theoretical probabilities of many of the activities they will learn in future lessons. It is a wonderful way to introduce probability to your students or start a probability unit.
Subjects:
Grades:
6th - 12th
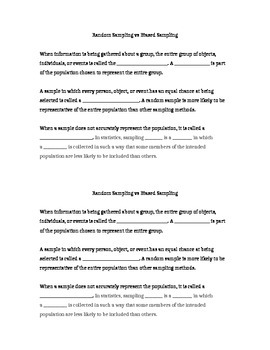
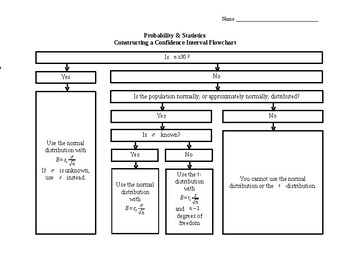
Confidence Intervals Flow Chart
Kids get stuck with the process of using a confidence interval? This easy to follow flow chart shows the simple step-by-step nature of using confidence intervals. 1) Mean (small sample size) 2) Mean (large sample size)
Subjects:
Grades:
11th - 12th
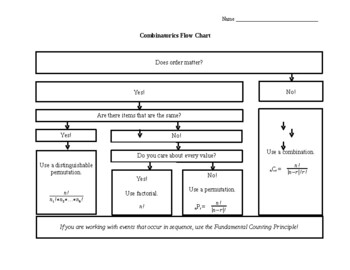
Combinatorics Flowchart
Have students who never can remember when to use a combination or a permutation? What about distinguishable permutations? Or just using the factorial option? This flow chart gives a good overview of when to use each method of combinatorics. Helpful for a college prep statistics student!
Subjects:
Grades:
9th - 12th
Types:
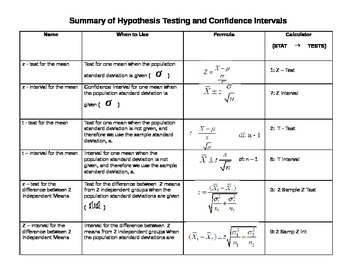
Statistics Inference Procedures Summary
This summary chart may be used for high school statistics or an introductory college statistics course. It includes all of the tests and confidence intervals for means, proportions, variances and a test for correlation. Very helpful for students who struggle with "Which test do I use??"
Subjects:
Grades:
11th - 12th, Higher Education
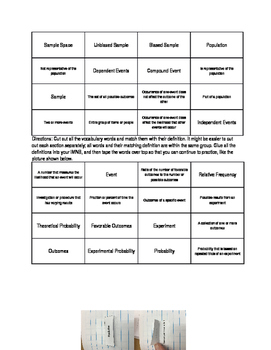
Probability Vocabulary Interactive Math Notebook Activity or Sort
This product includes a selection of probability vocabulary words and their definition. The original product was designed to be used in an interactive math notebook, but they could be used for a sort or other classroom activity instead. The product is a fully editable word document.
Subjects:
Grades:
6th - 9th
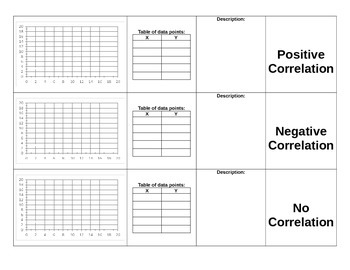
Scatter Plot Sort Activity
This is a graphic organizer/activity. Students have to fill out the graphic organizer that is about positive, negative, and no correlation. After every part of the graphic organizer is complete, the students need to cut out the individual boxes, then they need to mix up the pieces and try to "sort" them back together. After each student has sorted their own, I make them switch with each other and sort a different one. My students love doing this! They enjoy it even more when I make it into a com
Subjects:
Grades:
7th - 9th
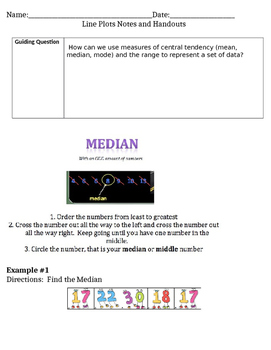
Line Plots Guided Notes
These examples provided guided practice and scaffolded notes for creating and answering word problems based on line plots. This was originally created for a guided group but can be used for whole-class lessons as well.
Subjects:
Grades:
6th

Data Analysis Foldable Bundle
Power point slides to have students create the foldable.This includes the printable version that should be printed in landscape or horizontally.
Subjects:
Grades:
9th - 12th
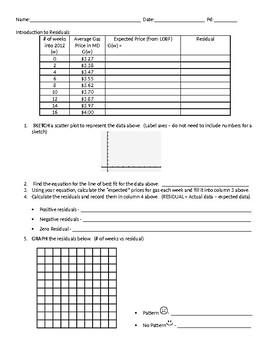
Introduction to Residuals
Notes sheet for the basics of Residuals for Algebra 1 statistics
Subjects:
Grades:
8th - 12th
Types:
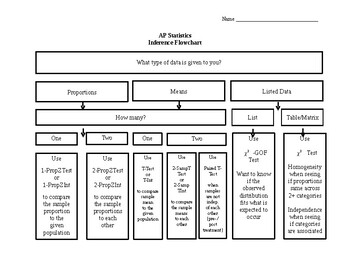
Statistics Inference Flowchart
When do I use the different kinds of hypothesis tests? This flowchart answers this question in an easy to follow manner.Included are t-tests, z-tests, and chi square tests.
Subjects:
Grades:
9th - 12th
Types:
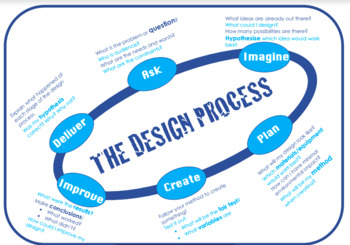
Design Process/Cycle
A design process/cycle to support students through their next science, design and technology or engineering unit of inquiry.
This resource can be edited to support all student's needs, curriculum links and teaching styles.
Each stage of the design process is aligned with questions to prompt students and promote deeper thinking.
Literacy links can be made with writing scientific experiments, procedural texts, and explanation texts. Numeracy links can be made to data collection, representation
Subjects:
Grades:
3rd - 10th
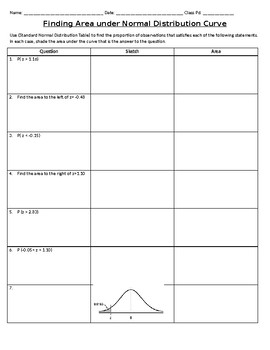
Finding Area Under Normal Curve
On this worksheet students are to find the area under a normal curve and complete a sketch of the normal curve.
Subjects:
Grades:
9th - 12th
Types:
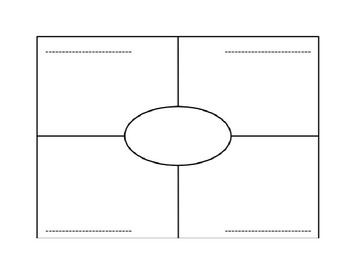
Mean median mode range
This is guided notes on a graphic organizer with an answer key.
It also includes 4 guided practice problems to check for understanding.
Answer key included.
I use this with my 6th grade students and an introductory.
Subjects:
Grades:
4th - 7th
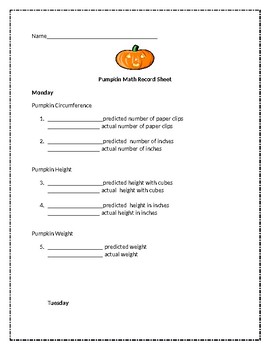
Pumpkin Math (Week Long Activities)
Throughout this fun filled week, children will explore:
-Circumference
-Weight
-Volume
- Distance
These are different hands on activities for each day of the week (Mon-Thurs)
Subjects:
Grades:
1st - 4th
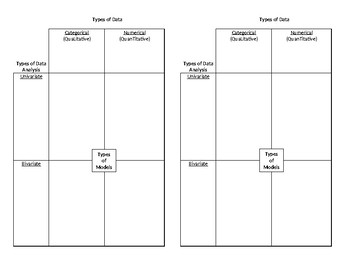
Intro to Data Analysis Graphic Organizer
I created this template for an introduction to my data analysis unit in Algebra I. We discuss and define categorical vs. numerical data, univariate vs. bivariate analysis, and the different graphs or models that apply to each. Since we use Interactive Notebooks, it is designed to be half a page.
Subjects:
Grades:
7th - 12th
CCSS:
Showing 1-24 of 48 results


